Saturday, February 25, 2012

R&D: the "gap" between Portugal and USA

Previous posts have discussed how strongly R&D spending changes between different business sectors and different sizes of firms.
It is obvious that Portugal and USA economies are very different, not only in size, but specially in structure. The largest contributors to R&D in USA are sectors not important in Portuguese economy. And statistics about firms show a near total absence of very large firms (larger than 10000 people, even larger than 5000 people) in Portugal. These structural differences have obvious implications about R&D expenses.
We will consider only the effect of very large companies. We have shown than firms larger than 10000 people contributed with half of the business R&D in USA and they were much more committed to R&D than the other firms. These kind of firms are not present in the 
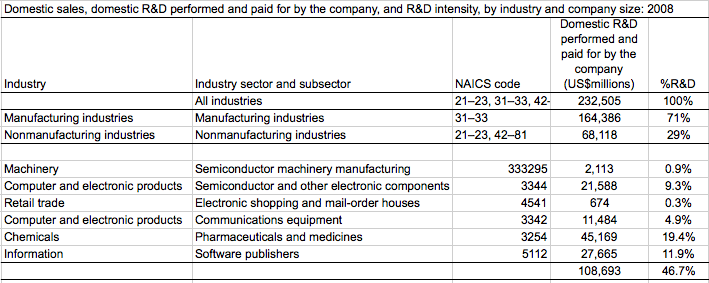
portuguese economy.  In 2009 USA firms with more than 5000 people paid and performed 137 b.USD of the total R&D bill (117 b for firms with more than 10000 people). Basically there are not this kind of firms in the portuguese economy. What happens if that extra propensity to R&D disappears, assuming that their contribution to the economy now would be  through smaller companies (less than 5000 people), with a propensity for business R&D around ⅓ of the propensity of very large companies?
If these companies were not present in USA economy, but assuming the same GDP, then business R&D would be smaller. From previous post, we estimate that ⅔ of business R&D the larger firms (>5000 people). This would mean ⅔ of 137 b.USD, or 91 b.USD - let’s assume a reduction of 90 b.USD in USA business R&D (paid and performed by industry), equivalent to 22.5% of R&D, and do a simple simulation.
Total USA R&D becomes 310 b.USD, 2.2% of GDP (not 2.9%), industry R&D would be 1.4% (not 2.1%). In this scenario the original gap between Portugal and USA (measured by R&D as % GDP) changes from 1.28% to 0.63% - half of the original one. And R&D performed by industry now compares 0.72% GDP (Portugal) versus 1.43%GDP (USA).
Our conclusion: around half of the gap between Portugal and USA is due to the structural effect of the higher propensity of very large companies to perform R&D.
This exercise did not consider the structural effect of different business structure, by industry sectors, between Portugal and USA economies. Of course size and sector effects are not independent neither fully cumulative. But an additional effect of lower R&D intensity sectors in the portuguese economy is indeed reasonable. 

So let’s simulate of reduction of 120 b.USD in USA business R&D, instead of 90. The new gap between R&D intensity is from 1.6% GDP (Portugal) to 2.0% (USA, instead of 2.9%), so 0.4% instead of 1.3%, and industry performed R&D gap is from 0.7% to 1.2% (instead of 2.0%), so 0.5% instead of 1.35%.
Our next conclusion: on a very preliminary basis, our guess of the additional effect of R&D intensity per industry sectors suggests that may be the “real” gap between Portugal and USA may be only one third of the “formal” one.
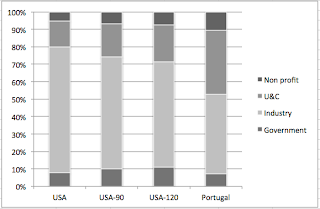
Next figure summarizes R&D % structure for these two scenarios (USA-90, USA-120) and the original ones for USA and Portugal.

R&D: Portugal versus USA

Portugal R&D was 3.6 b.USD during 2009 (IPCTN09), less than 1% that USA one (0.9%). But Portugal GDP (229 b.USD) was larger than 1% of the USA one (1.6%). Accordingly, the traditional indicator of national intensity of R&D (total R&D expenses as a percentage share of the GDP of the country) were very different: 1.59% (P) versus 2.87% (USA). The intensity of R&D at USA national level seems to be around twice that of Portugal.

Lets begin with the numbers of Portugal. Remember: here industry means private on farm business (everything minus agriculture, fishing, hunting, forest and government). The matrix of R&D “peformed by” versus “funded by” (see table) shows similarities and differences:
- The four most important cells of the matrix are the same:
- performed by government and funded by government (6.5% in Portugal versus 7.7% in USA, the same order of magnitude about the role of governmental labs)
- performed by industry and funded by government (2.6% in Portugal versus 9.9% in USA: the role of government funds in R&D performed by companies is much more important in USA than in Portugal)
- performed by industry and funded by industry (43% in Portugal versus 61% in USA: in both countries this is the major contribution to R&D - both in USA and Portugal, companies are the main performers and funding source of R&D activities, but this contribution is more significant in USA)
- performed by U&C and funded by government (31% in Portugal versus 8% in USA: U&C in Portugal depend much more on government funds that U&C in USA, where government funds go primarily to R&D performed by industry instead of U&C)
- The contribution of R&D performed by U&C and paid by U&C funds in marginal (exactly 2.9% of the total in both countries).
- The cell “performed by U&C and funded by industry” has the same marginal (less than 1%) order of magnitude in both (0.3% in Portugal versus 0.8% in USA)
- The marginal values of all the other cells do not show visible differences at the macro level
The marginal distributions of R&D “performed by” and “funded by” show the most important differences: the U&C role in performing R&D activities is more important in Portugal than in USA (36% versus 14%; we can read it the other way: the role of R&D performed by companies is less important in Portugal) and the government role is more important in Portugal (45% versus 31%; again we can read it other way: the role of business funds is less important in Portugal).
Non profit organizations have a similar contribution to R&D funding (3.7% versus 3.4%), but they perform a larger share of activities in Portugal (9% versus 4.4%), where they perform with much more funding from the government (performed by non profit organizations with government funds: 5% in Portugal versus1.8% in USA - so around ⅔ of their budget is paid by government funds in Portugal, against around ½ in USA). So non profit organizations are more dependent of government funds in Portugal (read it other way: they are more fragile and dependent on public money).  
Now let’s have a look and the distribution between R (research) and D (development) activities: share of R is higher in Portugal (56% versus 44%). Portugal R&D seems to be to much concentrated in R activities, more than in D activities (the other way: too little D).
We can compare the share of R work in total R&D per type of performer (see figure). Government labs are twice more oriented for R activities in USA than Portugal (78% versus 44%), but differences in other performers are not so dramatic. U&C are more D oriented in Portugal than in USA: 81% versus 94% of their R&D activities are research (not development).
Portugal R effort is 0.93% relative to GDP - close to USA (1.05%). So the budget for R (research) in Portugal is at the same level of USA one. (Surprised?). But portuguese D effort is below USA one: 0.67% of GDP versus 1.82%. Again, D intensity in USA R&D is three times more important than in Portugal.
All this suggests the usual “bad boy”: not enough D activities performed by industry: R&D activities performed and paid by industry are 72% of total R&D in USA, against 46% in Portugal; or, R&D activities performed and paid by industry are 2.07% of GDP in USA versus 0.72% in Portugal. Let’s do a simple calculation: what would be R&D performed in Portugal if industry had a similar contribution to R&D as in USA? It would be 2.94%, higher than USA one (2.87%)!. Is this reasonable. We do not think so. To be discussed in future post.

Thursday, February 23, 2012

In name of science: confusion.

Science and Public Policy is a leading international journal on public policies for science, technology and innovation. It covers all types of science and technology in both developed and developing countries.
(From the journal webpage; red type by me)

Oxford Journals (by Oxford University Press) is a well known publisher of academic journals. One of his titles (Science and Public Policy) tells a lot about the prevailing confusion between science and technology, and about the continuing process of appropriation of technology and innovation under the name of science.
This is a "social battlefield", where scientists try to expand the limits of their fiefdoms and to integrate very large and important non science areas (technology and innovation), in a quest for power and influence under the banner of science. This allows scientists to claim funds, policies, protocol importance, and privileges in the definition and management of policies related to technology and innovation.
The message is clear: in name of science, problems of technology and innovation are to be discussed as issues of science and public policy - not as technology and public policy, not innovation and public policy.
It also makes a subliminar suggestion that technology and innovation are the same thing, or directly related, and that they must be discussed as "science issues". As well as the usual "linear model" idea: science as the cornerstone and origin of technology and innovation.

Tuesday, February 21, 2012

How much was 2009 USA GDP?

For some one looking for statistical data about USA, the labyrinth of different sources of official data can be disturbing.
For instance, let’s try to find GDP, current prices, 2009 and its structure by industry.
US Census Bureau provides a table in the Statistical Abstract (here for 2012 edition, see table 670, released last September 2011): 2009 GDP is 14119 b.USD and manufacturing contributes with 1585 (11.2%). All industries is private industries minus agriculture, forestry, fishing and hunting: 12063, which means manufacturing is 13.1% of all industries value added. “All industries” appears often, specially in US Census data, and it means all sectors of the economy unless “agriculture, forestry, fishing, hunting”, and all government services and activities. According to previous data, “all industries” is the non farm private sector of the economy, and it means 89% of the economy. The remaining 11% are basically government: farm related business (agriculture, forestry, fishing, hunting) only contribute with 1%.

When we compare it with the estimates of 2009 ASM Annual Survey of Manufactures (here, see “Statistics for Industry groups and industries”), we get very different numbers per industry. From the estimates of each industry, manufacturing value added should have been 1976, a 26% higher estimate than the previous one (1585). Important differences per industry can be found when comparing table 670 (2009) with 2009 ASM estimates for value added per industry.
But BEA Bureau of Economic Analysis source about industry economic accounts (here) gives different numbers: 2009 GDP was 13939, manufacturing value added was 1540 (11% GDP) and all industries should have been 11878 (manufacturing = 13%). Detail per industry is available and can be compared with the previous two sources.

 We can also have a look at the 2011 Economic Report of the President (table B-12). GDP for 2009 was 14119, manufacturing 1549 and all industries 12063. The same values of US Census Bureau.
What if we look for an outside source? OECD Stat.Extracts for instance. USA GDP was 14119 in 2009 (the same as US Census), and manufacturing value added was 1733 (12.2% GDP, a different value from US Census). From OECD data we estimate “all industries” by GDP minus farm business minus government: 10349 (to be confirmed). GDP numbers are also available from IMF World Bank (World Economic Outlook, 2011 edition). For USA, 2009, value is 12703.

Next table provides the structure of manufacturing added value, by industries, from 2009 ASM (US Census) and BEA (Annual Industry Accounts) (b.USD and %):


Confused? Me too …
Different methodologies, different definitions and the revisions process may explain the differences. 
Macroeconomic data are estimates of an associated variance (error). Not exact numbers. So differences are not very relevant and significant. Different estimates tell a similar “story” in this case. But when comparing between different countries, industries, … that can be important - the same source must be used to guarantee homogeneity of data criteria.


(Update, 1 April: a good guide to these issues is available from BEA: "A guide to national income and product accounts of the United States")

Friday, February 17, 2012

R&D and size of firms

We can identify two main structural sources of variation among R&D performed by different companies: one effect associated with industry sector (some industry sectors have a much higher propensity to do R&D work than others) and another effect associated with the size effect. From the multiple surveys available, we know that large companies are more important contributors to R&D activities than SMEs. Let’s see what statistics tell us (USA, 2008).


First table summarizes R&D performed and paid by industries (business R&D) by different size classes (adapted from data available in Science and Engineering Indicators, 2012).
 Large firms, with more than 5000 people, employ ⅓ of the workforce in all industries (and 38% of the payroll). Very large firms, with more than 10000 people, employ 27% of total workforce (and 31% of payroll). This means that contribution of 10000+ firms is 83% of the employment of all 5000+ firms - a clear indication of the weight of very large firms in the 5000+ group.
Half of R&D performed and funded by industries is done by very large companies, larger than 10000 people. It would be 59% if we considered all companies larger than 5000 people.
Firms smaller than 5000 people employ ⅔ of industries workforce and perform 41% of business R&D. The importance of firms between 1000 and 5000 employees is dominant in this subgroup. (See second table).


Intensity of R&D is very different along the 5000 people border: (business) R&D per capita is 3614 USD for companies with 5000+ people, against 1246 USD for firms with 5000- people. The intensity of R&D is three times larger for companies 5000+. And the difference between 5-10000 and 10000+ is visible: 3724 versus 3088 USD. 


The importance of 5000-, 5 to 10000, and 10000+ firms in employment for each NAICS first level economic sector is shown in the figure. Very large firms (10000+) dominate in retail trade and information sectors, where they employ more than half of the workforce. But in utilities, transportation and finance and insurance, these size of firms contribute with 40 to 50% of employment. Manufacturing is not so much dominated by big firms.  
Considering the sectors that are top performers in R&D, we can see different scenarios of structure of firms by size. It is clear that both effects are not linear addicitive - an interaction between effects must exist.

RorD, not RandD

The title of this post is more than a review of formal boolean logic. It suggests than R&D is a rhetoric trick, and that RorD would be a much more correct formula to describe the activities of research and development in the economy and society.
R (research) and D (development) have very different objectives and outputs (science versus technology; discovery versus innovation) and they are performed by different people in different places (academia, federal government funded research centres versus business and industry) and funded with money of very different origins (government versus industry). And their motivations are also different (intellectual passions versus economic added value).
Canadian Benoit Godin, from INRS University (Quebec) is the most important source about the critical history of science & technology statistics and innovation statistics. His sociological approach shows these devolopments as outcomes of “social battlefields” related with games of power and politics at the international level and betwen powerful actors and institutions (like OECD, UNESCO, European Community, World Bank, …). His web page is a mandatory reference for all interested in the issues of innovation (“the idea of innovation”) and statistics of science and technology (“the culture of numbers”).
In a recent paper (Godin and Lane, “Research or development? A short history of research and development as categories”, 2012) he emphasizes that the real issue it is not applied versus basic research, but research versus development, and that Research OR Development is an appropriate way to formulate the issue, nor R&D.
D is much more important than R, in money terms. R&D is the result of the appropriation of D (industry) by R (academy), profiting of the much larger dimension of D in order to claim a large R&D, of course leaded by academy - not a D&R leaded by industry and business, who really pay around ⅔ of the R&D bill in USA. These has “helped the case of candidates looking for symbolic and popular support for public funding if research activity”:
  • "The co-mingling of research and development expenditures, activities and results had the effect of giving priority to research over development in policies. While research, which corresponds to one third of R&D expenditures, has specific categories to discuss it (basic and applied), the bulk of the R&D expenditures – two thirds is devoted to development – has no category at all. The difference in emphasis may be that governments’ funding of research has a large, articulate and influential interest group in university scholars, while there is no equivalent interest group for development."
  • "Why do measurements fail to differentiate R methods from D methods? Why do indicators exclude the methods and imperfectly measure the outputs of industry (surveys of innovation)? Historically, the pervasive emphasis on scientific research by its champions has completely overshadowed the equally important contributions of engineering development. Furthermore, the “free market” bias often prevents public policies from even considering industrial production as being eligible to share in the stream of public revenues allocated to technological innovation. The supreme irony is that industry – private sector corporations and their employees – generate the majority of revenues collected through taxation and dispensed to the public and non-profit sectors through government programs. Nations that establish policies accounting for the mechanisms and indicators of all three, research, engineering development and industrial production, would be best positioned to lead innovation in the Twentieth-First Century".
The so called "two cultures" issue, after C. Snow and F. Leavis polemics in the 60´s (after the science versus humanistic culture and life approaches) continue to be actual (see the continuous flow of literature about the issue). Within academy and the R&D world there is also a "two cultures problem" - between the practice and culture of science and of engineering development / technology. There is nothing wrong with that. What is wrong it is not to realize and to assume that difference, and to mislead the society assuming R&D, not RorD.
R&D formula is a direct consequence of the "linear model" that wrongly assumes that technology (D) is a consequence of research (R), a second step of a cycle that begins and works upon the results of science activities. So the driver of development would be found in science and research - the offer side. That is wrong: technology is driven by the demand side, and often even science (aplied R) is driven by the demands of technology (D). (Genuine pure or basic R is said to be driven by intellectual passions of the researcher). 
This suggests me a different possible formulation: DandR. Or may be DorR.

(Italics, our responsability).

Intensity of R&D in different sectors

In the previous post we have shown the structure of business R&D in USA economy (2008) and the strong concentration of these activities in a few subsectors. In this post we concentrate on the intensity of business R&D, defined as R&D performed and pais by the companies, in different business sectors. A certain contribution to R&D can be achieved by a large sector with an average intensity, or the same contribution can be achieved by a small sector with a very high intensity of R&D. The usual measure of R&D intensity is the ratio between R&D performance value and sales or income. For instance, National Science Foundation gives estimates of this ratio (see table 4-16 of Science and Engineering Indicators). In the previous post, we have used a similar, but different, ratio: R&D performed versus receipts. 
Now we will prefer a more structural indicator, more related to the macro variables of an economy - so we use the ratio of R&D performance versus value added of the sector (the contribution of the sector to national GDP). An alternative indicator, also considered, is the amount of R&D performed by capita in the sector.
The first table shows the share of business R&D, value added (GDP) and employment for the three top R&D contributors at the 2-digits NAICS sectors, that together mean 95% of business R&D (2008) . Manufacturing contributes with 71% of R&D, but manufacturing only has a 10% share of employment and the value added of manufacturing activities contributes only with 13% to GDP. Others (non manufacturing) activities have a strong structural footprint (near
70% of GDP, around 80% of employment) but its contribution to R&D is residual. We can properly say that most of the economic activities have a marginal role in R&D. Of course this is a very different picture from the popular one, that suggests that the average american business is very much committed to “invest” in R&D activities. Last two columns in the table are intensity indicators. Manufacturing contributes for R&D with 10% of its value added, but other non manufacturing sectors (not including information and professional services) only contribute with 0.1%. R&D per capita is specially high in manufacturing and information services (14k and 11k USD per employee), when compared with the others (less than 0.2k per capita). 


Next table summarizes the data for manufacturing subsectors. The four subsectors with largest volume of R&D only share 3.3% of employment and 18% of GDP, but contribute with 61% of R&D performance. These four subsectors also have higher R&D intensities (last two columns). 


Both indicators of R&D intensity are related (see next figure for 2-digits NAICS sectors), but the relationship is non linear (plot is log-log). In this figure, the size of the bubble is related with the R&D volume.

Previous table includes data for two industry sectors that were missing in previous post, because of restrictions by statistical secrecy. Due to problems of disclosure in the "petroleum and coal products" (NAICS 324), disclosure of "miscelaneous manufacturing" is also affected. We tried to estimate both numbers for business R&D performance. Using data from previous years, published by US Census (see table 805, Statistical Abstract of US: 2012), we can see that R&D intensity is petroleum and coal products has been very stable, and we can estimate its R&D performance to be around 8.2 bUSD, which makes R&D for miscellaneous manufacturing class (NAICS 329) to be around 0.3 bUSD. This allows us to complete the table. The petroleum and coal industries contribute with 3.5% for total business R&D, which makes it one medium tier contributor. But with a very high R&D intensity: the highest R&D per capita (higher, but close, to chemicals sector) and around 10% of its value added contribution to GDP. These numbers are coherent with the 325 NAICS sector (chemicals, as should be expected).
Miscellaneous manufacturing is a residual sector with marginal performance. Inclusion of data from these two sectors does not change the overall picture and conclusion previously drafted. But it includes petroleum and cola products as a top high intensity R&D sector, together with chemicals, and computer and electronic products.

Thursday, February 16, 2012

Business R&D and economic sectors

In this note we explore the differences between business sectors relative to their propensity to perform R&D activities.
We use USA 2008 data (last data available through Science and Engineering Indicators 2012, by NSF National Science Foundation) about R&D performed and paid by companies of different sectors, a direct measure of the commitment and importance of each sector to R&D activities. In this note, R&D means R&D performed and paid by business.
Let’s begin with industry groups defined by two digits NAICS classification, the top level groups of economic activities. Industry performed 72% of total R&D, and financed 84% of it - so other sources, basically federal government, funded only 16% of R&D performed by USA companies, mainly D activities).  In USA statistics, industry R&D has a meaning equivalent to business or corporate R&D in european statistics and literature (but it does not include agriculture and farm business).
Three industry groups (2 digits NAICS classification) contribute with more than 95% of R&D performed by industry: manufacturing is the most important (71%, around half of total R&D), followed at distance by information (16%) and professional, scientific and technical services (9%).Overall, non manufacturing sectors (services, but also including mining and primary metals) do contribute only with 29% of industry R&D (equivalent to 21% of total R&D). (Mining and primary metals together have only a 1% share of R&D).
The importance of these three groups of activities in corporate or business R&D is very different from their importance in the volume of economy. Next figure compares the overall structure of value added (GDP), receipts (equivalent to “sales” or turnover), employment, payroll and R&D by these sectors. Manufacturing (and information) activities has a much larger importance in R&D than in the other variables. 


Next figure shows R&D and receipts by top level NAICs industries. Receipts are here used as equivalent to sales, and statistics about receipts by companies are easily available from tax statistics. R&D shown as negative values in this figure.


Overall R&D intensity of USA industry, measured by the ratio R&D performed and funded by companies versus receipts of companies, is 0.69%.  Manufacturing sectors have an higher R&D intensity (1.9%) than average, but information sector has an even higher intensity (3%). Professional, scientific and technical services do have an 1.3% intensity. These three sectors have the largest R&D intensity of all industries. The remaining other sectors have an intensity of 0.05%. Near all business R&D activities are concentrated in these three 2-digits NAICS economic sectors.

Next let’s consider the next levels of NAICS. Next figure shows R&D performed and paid by business, both for all the first level industries previoulsy discussed as well as for the different manufacturing subsectors (3 digits NAICS code, bars group in the middle).
Within manufacturing, four subsectors show an higher level of R&D: “chemicals” and “computers and related electronic products” are the top ones, followed by “transportation equipment” and “machinery”. Together these four subsectors contribute with 60% of the R&D spending in manufacturing, and the first two together approached half of it (46%). At 3 digits NAICS code, these are the manufacturing subsectors concentrating most of the R&D effort. Together with “information” and “professional, scientific and technical services”, they do have a share of 84%.
If we go deeper in NAICS classification of economic activities, we will find that a very few subsectors contribute to half of all R&D (see table). Although small sectors, they have a very high R&D intensity, although a minor role in the volume of the economy.
R&D activities are very much concentrated in a small number of economic activities, and the R&D propensity of different sectors has a strong variation inter sectors. This means that the structure of the economic tissue must strongly influence the business R&D contribution to GDP, the classic indicator used to measure the level of commitment of companies and business to R&D, and very often  also used as a (bad) indicator of innovation.


Thursday, February 9, 2012

R&D in higher education: some facts

Universities are said to be the home of research, scientific and technological research. Let’s check some facts about the numbers of Universities and Colleges (UC) in the R&D statistics.
We begin with USA R&D data.

USA
1. Only a small share of total R&D is performed by UCs: less than 15% in 2009.
2. But the share of UCs in R&D has grown 2 to 3 times during last fifty years, from 5-6% to 13-14% (see figure).


3. Contribution of industry funds to R&D activities in UCs is less than 1%: the idea that industry financing is important for R&D in USA UCs does not pass a reality check.
4. Federal funds are the most important support for R&D activities in UCs, and they show a long term increasing trend in the share of R&D financing in UCs: from 3-4% to 7-8% during last fifty years (see figure, where sources of funds for R&D performed by UCs is shown as a percentage of total R&D). Federal funds supported 58-63% of UCs R&D bill during last decade.
 
5. In UCs, R&D basically means R: the role of UCs in D activities is minimal. More than 95% of R&D performed in UCs it is R (research activities), and D (development activities) are less than 5%.
6. Applied research has a small share of R activities: around 20%. This means that 75% of R&D activities in UCs are basic research (see figure: share of total and applied R relative to R&D in UCs).

 
7. The importance of UCs for total USA R activities has more than doubled during last fifty years, steadly increasing from 15 to 35%.(see figure). But close of ⅔ of R activities are not based on UCs.
 
8. Federal funding has grown at cagr=10.2% from 1953 to 2009, higher than the cagr for total R&D in the same períod of time (8.2%). 

Portugal
Now some numbers about Portugal R&D statistics (see figure: only from 1982 until now). Total R&D was 2.8 billion euros, against 400 billion USD in USA. R&D performed by UCs was funded with 1 billion euros in Portugal and 54 b.USD in USA.

 
A. UCs share of R&D is 36% (2009; 37% by 2010 preliminary data).
B. Share of UCs in total R&D activities have increased last twenty five years, from 20 to 37% (2010 preliminary data).
C. Industry funded 0.9% of R&D in UCs: very similar contribution to the USA one. Portuguese companies contribute with a funding similar to USA companies for R&D in UCs.
D. Government funds do support 86% of R&D in UCs.
E. D activities in UCs had a share of 19% during 2009 - much higher than in USA. R activities were 81% of R&D in UCs. Applied and basic R had similar importance (around 40% each): applied and development activities have much more importance in portuguese UCs than in USA ones.
F. More than half of national R activities are performed in UCs: 53% during 2009.

Wednesday, February 8, 2012

I&D empresarial em Portugal

O GPEARI publicou, com data de Novembro passado, um relatório de resultados provisórios sobre o IPCTN de 2010, com os principais dados estatisticos apurados. No entanto o quadro 2 (despesa em I&D, a preços correntes, por setor de execução, 1982 a 2010p, p. 5) têm um erro que distorce completamente a imagem do que tem acontecido com a I&D empresarial em Portugal nos últimos vinte anos, e que continua por corrigir (à data de hoje).
Pelos dados publicados, a contribuição das empresas para a despesa total em I&D (que na realidade, e sob o ponto de vista conceptual, se deveria dizer antes - investimento total em I&D) teria passado de 0% em 1982 para 45% em 2010 - ou seja, seria um fenómeno completamente novo dos últimos vinte anos, o que obviamente é falso.


Na figura junta mostram-se os números da % de despesa empresarial (coluna 2), tal como no referido relatório, e os números corretos, aliás também construidos com dados publicados na mesma tabela (coluna 1). A origem do erro é óbvia: alguém calculou a referida percentagem relativamente ao total fixo da despesa em 2010, em vez do total variável de cada ano. Um erro elementar de uso de excel!
Claro que só quem escreve e publica é que comete gralhas e erros. Mas o que choca neste caso é que pelos vistos ninguém tenha até agora dado pelo erro e feito uma correção ao pdf e mapa de excel, ainda por cima num organismo do estado com as responsabilidades e necessidade de credibilidade como o GPEARI.
A performance do I&D empresarial em Portugal nos últimos anos foi significativa, passando de 32% em 2001 para 50% em 2008 e 45% em 2010 (valor provisório). Sob o ponto de vista de estrutura de I&D fizemos uma aproximação substancial à média europeia e americana (ver figura). Sob o ponto de vista de intensidade (medido pelo habitual ratio entre a despesa empresarial em I&D e o PIB, a preços correntes) também (ver figura seguinte).


Seria interessante escalpelizar melhor a razão desta melhoria. Discutimos parte desta questão em trabalhao anterior (ver WP46 (2004) ). Não temos dúvidas que a intensidade do I&D empresarial aumentou, mas também não temos dúvidas que uma parte da sua maior visibilidade é explicada pela relevância que a explicitação das despesas em I&D passou a conhecer, por razões fiscais (especialmente grandes empresas) e pelo protagonismo político e social que a questão passou a ter (em parte também consequência dos inquéritos IPCTN). 
Felizmente que muitas empresas passaram a descobrir que I&D não é só investigação laboratorial e académica, mas é também muito daquilo que tradicionalmente eram despesas para aperfeiçoar produtos e processos, e para sobreviver e competir. Afinal as empresas portuguesas eram, e continuam a ser, mais inovadoras do que pareciam ( parecem) ser. Neste processo, os programas de apoios comunitários têm também tido um papel relevante.
No referido trabalho mostramos que o gap bem visivel no ultima gráfico entre a % de despesa empresarial em I&D em relação ao PIB, em Portugal e nos USA, não será afinal tão amplo como as estatisticas sugerem, tendo em conta as diferenças de estrutura (especialização setorial) e de dimensão (falta de muito grandes empresas em Portugal) do tecido empresarial dos dois países. Na altura estimamos que o gap real poderá ser apenas cerca de metade do anunciado pelas estatisticas.

Monday, February 6, 2012

Medir a inovação: os equívocos do manual de Oslo

Como se mede a beleza? Como se pode medir a felicidade? Perguntando.
Medir uma grandeza implica que seja possível a sua definição de forma razoavelmente precisa e operacional. Algo difícil, senão mesmo impossível, para a beleza, a felicidade, o amor, e … a inovação.
O problema aparece exemplarmente descrito na célebre cena sobre o capítulo I do fictício manual “Understanding poetry”, pelo fictício Dr. J. Evans Pritchard, Ph. D., no magnífico filme “Dead poets society” – todos compreendemos que a tentativa de Pritchard para quantificação do valor de uma poesia ou de um poeta é pueril, grotesca e insuficiente:
“If the poem's score for perfection is plotted along the horizontal of a graph, and its importance is plotted on the vertical, then calculating the total area of the poem yields the measure of its greatness”.
No filme, Keatting é brilhante a ridicularizar a situação. Mas na realidade muito do que tem publicado sobre medidas de inovação padece exatamente do mesmo problema.
Se inovação é “profitable change”, uma nova combinação que cria valor adicional (Schumpeter), como é que se pode medir algo tão "fuzzy", definido de uma forma tão pouco precisa e, acima de tudo, altamente subjetiva e dependente das circunstâncias locais e temporais?
As motivações para medir inovação são óbvias: se a inovação é o mecanismo de resposta á pressão competitiva da economia e da sociedade, e daí resultam os mecanismos fulcrais de contínuo crescimento económico a longo prazo, então medir a inovação é tomar o pulso ao potencial de crescimento económico, e à eficiência ou impacto das políticas “pró-inovação”. Um domínio politicamente muito sensível nos dias de hoje.

Em 2004 colaboramos num estudo para a (então) UMIC Unidade de Missão Inovação e Conhecimento, de que resultou uma publicação sobre "Mapear inovação e conhecimento em Portugal. Uma proposta para um sistema de indicadores e um programa de observação", onde se discutiram as questões associadas à medição da inovação (num país), e se trataram alguns problemas das várias metodologias (ver em especial cap. 2.1, p. 19 a 24). Será boa altura para rever alguns aspectos da questão.

A OCDE fez das estatísticas associadas com a ciência e a tecnologia, a investigação e desenvolvimento, e agora a inovação, quase uma indústria. A União Europeia também, via Eurostat. Milhões têm sido gastos para por de pé um sistema de medida e acompanhamento da inovação no espaço comunitário. Mas medir inovação obriga a uma definição mais operacional e menos fluida..
Por isso a OCDE e o Eurostat têm tentado estandardizar as metodologias estatísticas para medir inovação. A tradição europeia é medir  inovação por inquéritos a amostras (estratificadas) a empresas. Logo não mede diretamente a inovação, mas antes a percepção que os atores inquiridos têm sobre inovação. Isto apesar do inquérito pretender informar o inquirido acerca das definições adoptadas no manual de Oslo. As sucessivas revisões deste manual têm tentado (re)definir inovação de forma que a operacionalização prática da sua medida por inquirição seja (mais) viável.
A última revisão do Manual de Oslo (OCDE, 3ªed., 2005) define inovação e atividades inovadoras do seguinte modo:

  • An innovation is the implementation of a new or significantly improved product (good or service), or process, a new marketing method, or a new organizational method in business practices, workplace organization or external relations. The minimum requirement for an innovation is that the product, process, marketing method or organizational method must be new (or significantly improved) to the firm.
  • Innovation activities are all scientific, technological, organizational, financial and commercial steps which actually, or are intended to, lead to the implementation of innovations. Innovation activities also include R&D that is not directly related to the development of a specific innovation.
A imprecisão da definição é óbvio: como se define e mede “new” ou “significantly improved”? Há sempre uma componente subjectiva e culturalmente dependente na avaliação dessas situações. Logo o sentido de inovação não é o mesmo num dado ano em paises tão diferentes como, por exemplo, a Alemanha e Chipre.
A tentação de incluir à força as atividades científicas como inovação é patente. A confusão entre investigação científica e desenvolvimento tecnológico também. Um disparate, como temos argumentado em posts anteriores – mas um disparate que se compreende como políticamente correto por óbvias razões corporativas da prórpia comunidde científica. Veja-se, por exemplo, a última frase da citação (italico da minha responsabilidade).
O título completo do Manual de Oslo, é elucidativo: “The measurement of scientific and technological activities. Proposed guidelines for collecting and interpreting technological innovation data. Oslo Manual” e reflecte a confusão e o disparate anterior. Note-se que no título se refere apenas a inovação tecnológica, e que o próprio título parece sugerir que medir a inovação tecnológica é um subcapítulo de medir actividades científicas e tecnológicas (ou seja, a inovação tecnológica seria uma consequência das actividades de investigação e desenvolvimento). 

Mas depois o manual considera como principais tipos de actividades de inovação: inovação de produtos, inovação de processos, inovações de marketing e inovações organizacionais – ou seja, ultrapassando completamente o conceito mais restrito de inovação tecnológica e abraçando (melhor: apropriando-se) do conceito de inovação em geral, mesmo que as fontes inspiradoras de algumas dessas categorias mais importantes de inovação possam nada ter a ver com actividades de R&D, ou atividades científicas e tecnológicas.
A apresentação do manual na página na OECD fala também por si e pelo esforço de apropriação do conceito de inovação como inovação tecnológica (ou industrial):

  • The ability to determine the scale of innovation activities, the characteristics of innovating firms, and the internal and systemic factors that can influence innovation is a prerequisite for the pursuit and analysis of policies aimed at fostering technological innovation. The Oslo Manual is the foremost international source of guidelines for the collection and use of data on innovation activities in industry.
Mas na primeira edição (1992), essa apropriação era ainda mais flagrante, pois excluia a inovação organizacional e a inovação nos serviços, e considerava apenas a inovação de produto e de processo em ambientes de produção industrial (“manufacturing”), que serão as mais diretamente associadas ás actividades do sistema sientífico e tecnológico. A segunda edição (1997) estendeu a inovação aos serviços – mas sem abandonar a insistência na componente científica e tecnológica. A terceira revisão, e última até ao momento, alarga as fronteiros da inovação, mas, como se víu, não abandona completamente o disparate da associação direta entre inovação e actividades de R&D em ciência e tecnologia.
Esta pequena digressão pela história do manual de Oslo é útil, pois mostra que, no período de pouco mais do que uma década, perante a evidência crescente do disparate da inovação com produto direto do sistema científico e tecnológico, a OCDE mudou mais do que uma vez, e substancialmente, a definição operacional de inovação para fins estatísticos – o que torna muito problemática qualquer comparação de resultados de inquéritos ancorados em diferentes revisões do manual. Manual que foi, e é, a base das estatisticas europeias sobre inovação – em especial os CIS (Community Innovation Surveys). Um dos próximos capítulos.

Sunday, February 5, 2012

Ciência e tecnologia: revisitando Tycho Brahe

Tycho Brahe (1546-1601) foi uma personagem fantástica do Renascimento. Um excêntrico e faustoso nobre dinamarquês, contestário, uma personagem forte, mas pouco recomendável. Um tirano irrascível nos seus domínios, um artista da intriga palaciana, homem de grandes bebidas e comidas.
Mas também um homem que ajudou a mudar a visão cósmico do mundo, a inventar a "nova astronomia" e a criar a ideia de conhecimento com base empírica em dados observados, ligados à realidade, e rejeitando uma realidade como consequência de teorias metafísicas.
Vale a pena rever esta personagem, na sequência dos post anteriores sobre ciência e tecnologia.

Em primeiro lugar por causa do valor de observações únicas ou raras em ciência, e da importancia do contexto teórico no conhecimento científico. Tycho apercebeu-se, com espanto e até mesmo com incredulidade, do aparecimento de uma nova estrela, na noite de 11 de Novembro de 1572, quando se preparava para ir jantar, e se deslocava do seu "laboratório" (hoje considerado como o primeiro centro de investigação moderno, dedicado à observação experimental dos astros) para a sua casa.  
Hiparcos, 125 anos antes de Cristo, anunciou ter observado algo semelhante, o que era incompatível com a teoria. Por isso o anuncio de Hiparcos era tido como um "erro", incompatível com o quadro de referência clássico, uma observação não credível e nunca confirmada. Mas a observação de Tycho dava nova vida a uma tal observação e implicava a falsificação da doutrina clásssica, segunda as qual as estrelas eram parte imutável do universo. A observação de Tycho, entretanto confirmada por outros astrónomos, suportava a falsidade do quadro de referencia vigente - daí a sua importância. 
“A reprodutibilidade de um facto torna a sua observação excecionalmente fiável, enquanto que a sua recorrência revela que faz parte de um sistema natural” (Polanyi, Personal knowledge, pg. 137). O interesse sistemático de um facto pode ultrapassar completamente a sua ausência de regularidade – caso da descoberta de Tycho nessa noite de 1572, quando integrado num contexto teórico que o torna relevante. Tycho certamente não teria notado o fenómeno (como muitos outros que não o viram) se não estivesse rotinado na observação sistemática do céu, e se não tivesse acumulado um enorme conhecimento tácito da geografia celestial nessa zona – e se não tivesse uma motivação sistemática ou teórica para se interessar pelo acontecimento. Mentes preparadas ou motivadas são fundamentais para o processo de descoberta.

Em segundo lugar porque Tycho começa a modificar o paradigma prevalecente do conhecimento clássico. Tycho foi um observador sistemático do céu, e tentou mesmo formular um modelo que estivesse de acordo com o que observava, ou pelo menos com uma parte importante daquilo que observava. O seu modelo geo-heliocentrico, que ele julgava coerente com as observações existentes, era um modelo misto entre o proposto por Copérnico e o clássico de Ptolomeu. Por exemplo, as fases do planeta Vénus, que não eram explicáveis pela teoria clássica, eram coerentes com a proposta de Tycho. Apesar de ter conhecido alguma popularidade, o modelo de Copernico acabou por se impor, especialmente depois de Galileu. 
O grande contributo de Tych foi metodológico, na recolha sistemática e precisa de dados astronómicos. “Tycho não terá sido um génio criativo, mas foi um gigante da observação metodológica”, diz Koestler (The sleepwalkers, 1968, p. 297).
A construção teórica suportada e guiada pela evidencia empírica foi uma importante novidade introduzida por Tycho, que se apercebe de que para compreender a astronomia eram necessárias observações precisas, mesmo muitíssimo precisas, mas também continuadas ao longo de anos (Koestler, p. 289). “A navegação oceânica, a crescente precisão dos compassos magnéticos e dos relógios, e o progresso da tecnologia criou um novo clima de respeito pelos factos por si e pelas medidas exatas”, recorda Koestler (p.290).
Foram as observações precisas e continuadas do céu permitiram a Tycho um remapeamento celestial, uma nova cartografia do céu, com mil estrelas, o que na altura representou um investimento fabuloso.


Em terceiro lugar, Tycho foi um tecnólogo que desenvolveu novos instrumentos para a observação precisa do céu. Desenhou e construíu múltiplos  instrumentos para medir com precisão a posição dos astros - uma absoluta novidade para a altura, com o adicional dos instrumentos serem desenhados para serem fáceis de montar / desmontar e transportar. 

O que vemos aqui é uma estranha ligação entre a descoberta científica e a inovação tecnológica motivada pelas necessidades da ciência - exactamente no sentido inverso do tradicional modelo "linear" da inovação. 
Mas o grande “tesouro” de Tycho eram afinal as suas coleções de dados sobre os astros, dados precisos e contínuos no tempo, em especial sobre o “planeta difícil”, Marte. Nunca ninguém tinha antes acumulado um tesouro destes. Kepler terá sonhado com o acesso a esses dados, que Tycho guardava ciosamente, quando, nos seus últimos tempos de vida, contratou Kepler como assistente de investigação.
Porque é que, para Kepler, os dados de Tycho sobre a órbita de Marte tinham a chave para o segredo do movimento dos planetas? Porque a órbita de Marte parecia afastar-se muito do circular. 

As observações coligidas por Tycho eram  aliás um drama para ele próprio, que defendia órbitas circulares no seu modelo geo-heliocentrico ( a Lua e o Sol andam à volta da Terra, enquanto que os outros planetas - Mercúrio, Vénus, Marte, Júpiter e Saturno - andam à vota do Sol, todos envolvidos por uma esfera de estrelas fixas), e que por isso considerava esas observações como um grande e perigoso segredo. Mas para Kepler eram a oportunidade de poder traçar, ponto a ponto, a órbita do planeta e assim identificar a geometria da sua órbita – que afinal veio a verificar que era elíptica. Um facto que nem para Kepler fazia grande sentido: a que propósito é que havia de ser elíptica, e não circular? Ou outra forma de curva fechada? Na ausência de uma mecânica gravítica era difícil compreender a descoberta de Kepler. Seria Newton, alguns anos mais tarde, a esclarecer a questão. Um bom exemplo sobre a questão, abordada em post anterior, de que os dados em ciência só fazem sentido no contexto da teoria,

As leis de Kepler (órbitas elípticas dos planetas; velocidade linear variável ao longo da órbita, mas velocidade angular constante) foram as primeiras leis das modernas ciências naturais, inferidas a partir de observações empíricas. Koestler (1968, p.318) identifica aí "o divórcio da astronomia relativamente à teologia, e o seu casamento com a física".
Mas nem os modelos cósmicos de Tycho ou de Kepler sobrevieram até hoje à crítica da ciência. Sem prejuizo da relevância dos seus contributos. Mas as leis de Kepler sobreviveram, mesmo que o modelo cósmico de Kepler não tenha sobrevivido.
A morte de Tycho (em Praga, depois de sair da Dinamarca, na sequência de conflitos com o seu rei, que o levaram a abandonar, com grande pompa e espalhafato, o seu país de origem), esteve à altura da sua vida fantástica – e ainda hoje constitui um dos grandes enigmas da história, cuja exploração continua a ser desvendada por modernos métodos forenses. 
Sabe-se agora que afinal terá morrido por envenenamento com mercúrio. Experiências de alquimia que deram mal resultado? Ou a “vingança” de Kepler, que afinal seria depois o seu continuador como matemático oficial do rei? Ou antes vingança de Cristiano, então jovem rei da Dinamarca, sobre complicadas histórias familiares e de afrontas públicas e privadas, que aliás tinham estado na origem da sua saída da Dinamarca? (sobre o assunto ver artigo do Spiegel). Aguardam-se os resultados da última exumação de Tycho, feita em 2010.